Georgia Tech OMSA (Georgia Institute of Technology Online Master of Science in Analytics)
-
Important Links:
Unofficial OMSA Slack Directory
Georgia Tech MicroMasters Program: Analytics: Essential Tools and Methods
Georgia Tech MicroMasters course codes
Georgia Tech school calendar 2019-20
Georgia Tech MicroMasters Program lecturers/staff
Georgia Tech academic calendar 2019-2020
Georgia Tech academic calendar 2020-2021
Georgia Tech OMS Analytics start dates 2020-2021
Georgia Tech OMS Analytics computational data analytics track
Georgia Tech course projections
Georgia Tech OMS analytics google docs with course syllabus links
Georgia Tech OMS analytics 2019 Summer and Fall Class list
LInks to good foundational maths classes
best link for converting EDT to AEST
spreadsheet with lots of useful information summarising each subject
-
Proposed subject choices...
Georgia Institute of Technology MicroMasters Program in Analytics: Essential Tools and Methods
Summer 2020 (mid May-mid Aug)
- ISYE 6501x Introduction to Analytics Modeling [introductory core subject]
- MGT 6203x Data Analytics for Business [advanced core subject]
Fall 2020 (mid Aug-mid Dec)
- CSE 6040x Computing for Data Analysis [introductory core/computing subject]
Georgia Institute of Technology Online Master of Science in Analytics.
Spring 2021 (mid Jan-mid May)
- CSE 6242 Data and Visual Analytics [advanced core/computing subject]
Summer 2021 (mid May-mid Aug)
- MGT 6754/8803 Introduction to Business for Analytics [introductory core subject]
Fall 2021 (mid Aug-mid Dec)
- ISyE 6414 Regression Analysis [statistics subject]
or - ISYE 7406 Data Mining and Statistical Learning [statistics subject]
or - ISyE 8803 High-Dimensional Data Analytics [statistics subject]
Spring 2022 (mid Jan-mid May)
- CSE/ISyE 6740 Computational Data Analytics (Machine Learning) [statistics/computing subject]
Summer 2022 (mid May-mid Aug)
- ISyE 6644 Simulation [operations subject]
Fall 2022 (mid Aug-mid Dec)
- CS 7643 Deep Learning [elective computing subject]
or - ISYE 7406 Data Mining and Statistical Learning [elective statistics subject]
or - ISyE 8803 High-Dimensional Data Analytics [elective statistics subject]
Spring 2023 (mid Jan-mid May)
- CS 6400 Database Systems Concepts and Design [elective computing subject]
or - CSE 6250 Big Data in Healthcare [elective computing subject]
or - CS 7642 Reinforcement Learning [elective computing subject]
Summer 2023 (mid May-mid Aug)
- CSE/ISyE/MGT 6748 Applied Analytics Practicum
-
ISYE6501:
Homework Tips:
- If you cannot correctly download/open someones docx file for grading from edX (eg it shows up as a zip file or something unintelligible), rename the file so that it has a .docx extension at the end. It should now be able to be opened by MS Word.
- If you wish to upload an RStudio markdown file to edX, rename the '.rmd' extension to '.txt' and advise the person grading the assignment to rename it to '.rmd' after downloading.
- If you find that chunks of code or text are somehow randomly excluded from your pdf files after converting from markdown format to pdf, try splitting up code or text blocks into smaller blocks and re-attempt the conversion.
Essence of calculus
Good introductory video for R
Good notes for SVM
Good video to understand SVM
R package to display formulas from models
summary of difference between knn and k-means
Good video for explaining k-means
Visualising PCA
ISYE6501 lecture transcripts
advice for studying for ISYE6501
ISYE6501 Slack Channel
Good video for Eigen values and vectors
time series and forecasting
useful links for learning Arena
good comparison of models part 1
good comparison of models part 2
optimising shelf space for linear programming
Dedupe for combining data sets and entity resolution
linear algebra course
ISYE6501 quizlet
python for data science cheat sheet
machine learning project checklist
plagiarism detection system used by Georgia Tech
visualising PCA
exponential smoothingAlso of interest:
how to deal with imbalanced data sets 1
how to deal with imbalanced data sets 2
-
In May this year I began an Analytics: Essential Tools and Methods MicroMasters developed by the Georgia Institute of Technology (GTx) and delivered through the massive open online course (MOOC) provider EdX.
Subjects offered within the MicroMasters are exactly the same as those provided for the highly respected 'Online Master of Science in Analytics' (OMSA) offered by Georgia Tech and can be directly credited towards the full masters program. One caveat to consider, however, is that the credited subjects cannot contribute towards one's GPA in the OMSA.
I'm happy to say that I have received my certificate for completing the first subject in the MicroMasters program: "Introduction to Analytics Modeling". This subject was quite challenging, particularly in the context of a condensed US university Summer semester and I can honestly say that I learned a lot. A highlight for me was to learn how to use Simpy, a discrete-event simulation framework based on Python, for process optimisation. Subsequently, as part of my final project, I became aware of Syngenta's use of a range of analytical tools (including discrete event simulation) to gain estimated savings of $287 million across their seed product development pipeline between 2012-16 . That's quite an impressive statistic. It was also great to get a look under the hood of a range of machine learning methods for data analysis and my R coding skills definitely got a boost.
I was additionally quite excited to use the EdX platform for the first time. EdX is the only major MOOC platform that is non-profit and open-source. You can view a recent interview with Anant Agarwal, the founder of EdX, here. He really does have a vision for making education affordable worldwide.
I would like to say that my experience was 100% positive, however, unfortunately there were technical issues along the way. Sometimes I couldn't upload/download certain file types for the assignments. Sometimes I would spend hours grading someone's assignments and then find I was not allowed to submit the grade. Worst of all however, the exam monitoring software crashed in the middle of my final exam (worth 25% of the final grade) and I subsequently received a 0 for it. [After some negotiation I was eventually able to receive an imputed score for the exam and have it displayed in edX].
Despite these difficulties, I'm continuing onwards with the remainder of the MicroMasters. Who knows, I might even get some time to fire up a Docker container with the EdX platform myself and have a look at fixing some bugs. One thing I'd particularly like to see addressed is the platforms overall ability to cope with unstable internet connections. After all, unstable internet connections remain common place throughout the world (and are inherent with wireless/mobile).
As a final note, I'm left wondering why no Australian universities offer cost-effective online masters courses for Analytics/Data Science like the Georgia Institute of Technology. The University of Adelaide has a ~1.4 year Graduate Diploma in Data Science for ~31K AUD. The University of New south Wales has a ~2 year Master of Data Science for ~50K AUD. RMIT has a ~2 year Master of Data Science Strategy and Leadership for ~42K AUD. Finally, James Cook University has a 2.7 year Master of Data Science for ~53K AUD. All of these options hardly compare to a ~14K AUD (9.9K USD) cost for the ~3 year OMSA or Online Master of Science in Computer Science (OMSCS) offered by Georgia Tech.
-
CSE6040:
Glossary of mathematical symbols
Python regex regular expressions
Fall 2020 CSE6040 slack channel
CSE60040 Spring 2021 timetable
The Elements of Statistical Learning
Download all files in a path on Jupyter notebook server
Python Pandas Tutorial: A Complete Introduction for Beginners
Algorithms, DataStructures and Big O Notation
Hint for Problem5 of the "More Python Exercises on Vocareum":
You can use the list.count(element) method to determine how many times element appears in list. Use a sanity check for when the list contains fewer than 2 elements.
Comparing boolean and int using isinstance
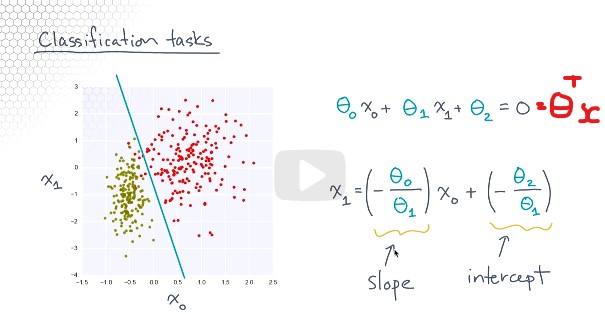
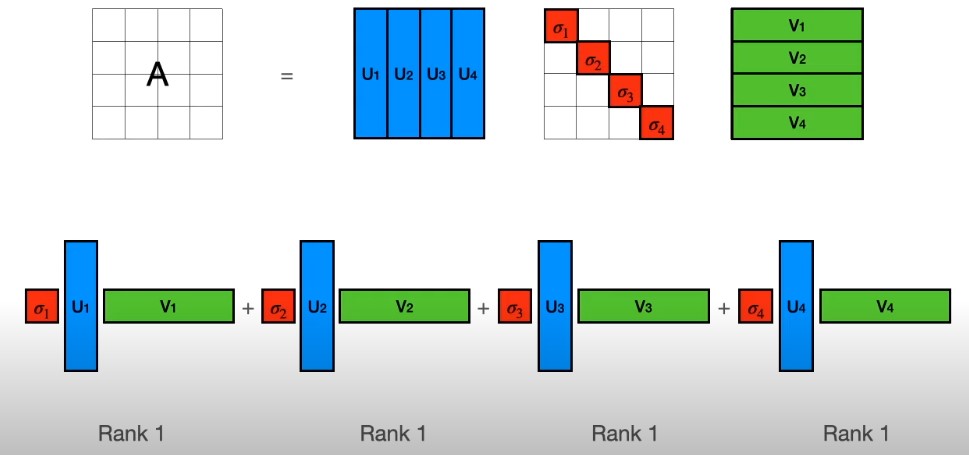
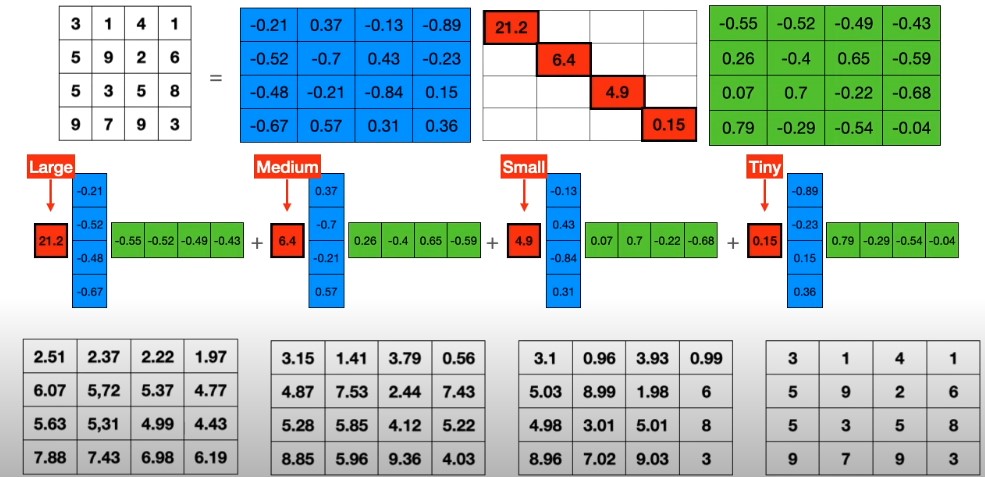
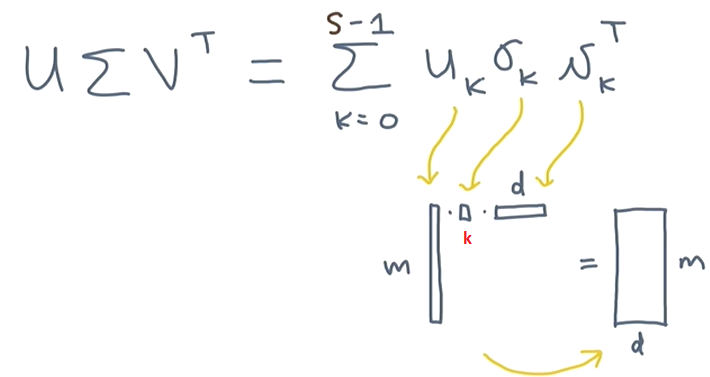
5 Must-Know Applications of Singular Value Decomposition (SVD) in Data Science
Python:
https://ehmatthes.github.io/pcc/cheatsheets/README.html
https://learnxinyminutes.com/docs/python/
https://sites.engineering.ucsb.edu/~shell/che210d/python.pdf
http://www.eas.uccs.edu/~mwickert/Python_Basics.pdf
Pandas:
https://pandas.pydata.org/pandas-docs/stable/user_guide/dsintro.html
https://www.learndatasci.com/tutorials/python-pandas-tutorial-complete-introduction-for-beginners/
Numpy:
https://cs231n.github.io/python-numpy-tutorial/
https://sites.engineering.ucsb.edu/~shell/che210d/numpy.pdf
Regex:
https://www.regular-expressions.info/characters.html
https://regexone.com/lesson/introduction_abcs
https://www.debuggex.com/cheatsheet/regex/python
https://www.pythonsheets.com/notes/python-rexp.html
Data Structures, List Comprehension
https://spapas.github.io/2016/04/27/python-nested-list-comprehensions/
https://livebook.manning.com/book/python-workout/chapter-4/v-3/92
https://docs.python.org/3/tutorial/datastructures.html
https://openbookproject.net/thinkcs/python/english3e/dictionaries.html
https://www.cs.cornell.edu/courses/cs1110/2018sp/lectures/lecture14/presentation-14.pdf
https://treyhunner.com/2015/12/python-list-comprehensions-now-in-color/Notes for Notebook 2:
∀ is read "for all"
⇒ is read as "implies"
∈ Denotes set membership, and is read "in" or "belongs to". That is, x ∈ S means that x is an element of the set S
A=set of possible pairs
⊥ denotes the logical predicate always false. As a binary operator, denotes perpendicularity and orthogonality.
How to download notebooks from Vocareum:
Method 1:
- Before opening the notebook - check the box next to the notebook name (ie ‘part0.ipynb’) and a download button pops up toward the top of the screen.
Method 2 (this works!):
- To download all the contents of the notebook (including starter code and the notebook version after you've worked on it), select any notebook and enter this command in a cell:
!tar --exclude='*/.voc' --exclude='*/.voc.work' -chvzf notebook.tar.gz ../../*- This will create notebook.tar.gz file in the same folder as the notebook you've entered this command. For example for notebook 1, I ran this command in 0-basics.ipynb, it created the .gz file, that you can open with 7-zip, program in windows for example:
The Structure of the unzipped folder will like this snapshot, a folder each part (part0, 1, and 2). Inside each folder you can see the starter code in "resource folder" and the modified version after your worked on it in "work folder"
Final note: notice the "../../" part of the commands goes two level up, so it should be enough to capture the different parts of a certain notebook. I believe if you used "../../../" you will download all the notebooks (available so far) in one shot.
Method 3 (this works (although not for all notebooks)):
- Navigate to the folder containing the notebook in Vocareum (often using the menu button in the top left corner)
- In the Actions menu (top, right corner) choose 'Download starter code' and save it to a folder on your PC. Unzip the folder on your pc and navigate to the 'startercode.0' folder. The ipynb file will be in there. Install Jupyter on your PC so you can open it.
- If there are any data files associated with the notebook you will need to download them too. In the 'startercode.0' folder on your PC, create a 'resource' folder, then an 'asnlib' folder inside, and then a 'public data' folder inside that. Navigate to the folder containing the notebook in Vocareum. Click on the 'resource' folder, then the 'asnlib' folder and then 'public data'. Download all the contents into the 'public data' folder on your PC.
Notes for Notebook 3:
≡ Denotes an identity, that is, an equality that is true whichever values are given to the variables occurring in it. In number theory, and more specifically in modular arithmetic, denotes the congruence modulo an integer.Notes for Notebook 4:
≪ , ≫ Mean "much less than" and "much greater than".
ϵ , machine epsilon
∥x∥ is the norm of x (i.e. the length of the vector x)
online decimal to binary converter
Kahan summation algorithm
Accurate algorithms for computing sums
Floating Point Arithmetic: Issues and Limitations <-very usefulNotes for Notebook 5:
good online regex tester/editor
Notes for Notebook 7:
- Inner-join: Keep only rows of A and B where the on-keys match in both.
- Outer-join: Keep all rows of both frames, but merge rows when the on-keys match. For non-matches, fill in missing values with not-a-number (NaN) values.
- Left-join: Keep all rows of A. Only merge rows of B whose on-keys match A.
- Right-join: Keep all rows of B. Only merge rows of A whose on-keys match B.
good reference for sorting pandas data frames
How to define dataframes in pandas:
df1 = pd.DataFrame(
    {
        "A": ["A0", "A1", "A2", "A3"],
        "B": ["B0", "B1", "B2", "B3"],
        "C": ["C0", "C1", "C2", "C3"],
        "D": ["D0", "D1", "D2", "D3"],
     },
     index=[0, 1, 2, 3],
 )

#################
#Alternative method: #
#################

df=pd.DataFrame(columns=['C1','C2','C3'],
                 data=list(zip(['A','B','C'],
                               [1,3,5],
                               [2,4,6]))
                )
How to slice and select data from pandas data frames in Python:
linkIn [68]: df1 Out[68]: 0 2 4 6 0 0.149748 -0.732339 0.687738 0.176444 2 0.403310 -0.154951 0.301624 -2.179861 4 -1.369849 -0.954208 1.462696 -1.743161 6 -0.826591 -0.345352 1.314232 0.690579 8 0.995761 2.396780 0.014871 3.357427 10 -0.317441 -1.236269 0.896171 -0.487602 ######################### Select via integer slicing: ######################### In [69]: df1.iloc[:3] Out[69]: 0 2 4 6 0 0.149748 -0.732339 0.687738 0.176444 2 0.403310 -0.154951 0.301624 -2.179861 4 -1.369849 -0.954208 1.462696 -1.743161 In [70]: df1.iloc[1:5, 2:4] Out[70]: 4 6 2 0.301624 -2.179861 4 1.462696 -1.743161 6 1.314232 0.690579 8 0.014871 3.357427 ######################### Select via integer list: ######################### In [71]: df1.iloc[[1, 3, 5], [1, 3]] Out[71]: 2 6 2 -0.154951 -2.179861 6 -0.345352 0.690579 10 -1.236269 -0.487602 In [72]: df1.iloc[1:3, :] Out[72]: 0 2 4 6 2 0.403310 -0.154951 0.301624 -2.179861 4 -1.369849 -0.954208 1.462696 -1.743161 In [73]: df1.iloc[:, 1:3] Out[73]: 2 4 0 -0.732339 0.687738 2 -0.154951 0.301624 4 -0.954208 1.462696 6 -0.345352 1.314232 8 2.396780 0.014871 10 -1.236269 0.896171Notes for notebook 10:
-
Good link for understanding CSR representation of sparse matrices
-
Another good link for understanding CSR representation of sparse matrices
My explanation of CSR:
cols = [1, 2, 4, 0, 2, 3, 0, 1, 3, 4, 1, 2, 5, 6, 0, 2, 5, 3, 4, 6, 3, 5] values = [1, 1, 1, 1, 1, 1, 1, 1, 1, 1, 1, 1, 1, 1, 1, 1, 1, 1, 1, 1, 1, 1] rowptr = [0, 3, 6, 10, 14, 17, 20, 22]- You use the values in rowptr as indices to slice cols and values up into rows that contain non-zero values. Eg. rowptr values 0 and 3 are used to slice cols into [1,2,4] and values into [1,1,1]. rowptr values 3 and 6 are used to slice cols into [0,2.3] and so on....
Notes for notebook 11:
How to connect to a database with Python sqlite3 and do a query:
    conn = load_db('dbs/Database1.db')
    queryz="""SELECT * FROM Database1 LIMIT 5"""

    ###METHOD WITHOUT pandas###
    cur = conn.cursor()
    cur.execute(queryz)
    all_results = cur.fetchall()
    print(all_results)

   ###METHOD WITH pandas#######
    df=pd.read_sql_query(queryz, conn)
    print(df)
INNER JOIN(A, B): Keep rows of A and B only where A and B match
OUTER JOIN(A, B): Keep all rows of A and B, but merge matching rows and fill in missing values with some default (NaN in Pandas, NULL in SQL)
LEFT JOIN(A, B): Keep all rows of A but only merge matches from B.
RIGHT JOIN(A, B): Keep all rows of B but only merge matches from A.How to left join a table twice to another table with Python sqlite3 and rename the columns:
###Table1###
#	ID 	A 	B
#0 	0 	0 	1
#1 	1 	0 	6


###Table2###
# 	ID 	X 	Y
#0 	0 	167 	556
#1 	1 	153 	766
#1 	6 	088 	942

query = '''
        SELECT Table1.ID AS IDZ, Table1.A AS AZ, Table2a.X AS AX, Table2a.Y AS AY, Table1.B AS BZ, Table2b.X AS BX, Table2b.Y AS BY
        FROM Table1
        LEFT JOIN Table2 AS Table2a
        ON Table1.A = Table2a.ID
        LEFT JOIN Table2 AS Table2b
        ON Table1.B = Table2b.ID

'''
###Results###
#	IDZ 	AZ 	AX 	AY 	BZ 	BX 	BY
#0 	0 	0 	167 	556 	1 	153 	766
#1 	1 	0 	167 	556 	6 	088 	942
Notes for notebook 12:
A very good explanation of derivatives
Calculus Made EasyNotes for notebook 13:

Notes for notebook 15:
good video explanation of PCA
excellent video explanation of singular value decomposition


-
MGT6203:
Resources on how to learn R:
- R for Datascience: http://r4ds.had.co.nz/
- RStudio Education: https://education.rstudio.com/
- Swirl: SwirlStats.com
- DataCamp: DataCamp.com/courses/free-introduction-to-r
Difference between one hot encoding and dummy variables:
- One hot encoding:
-- Red: 1,0,0
-- Blue: 0,1,0
-- Green: 0,0,1 - Dummy:
-- Red: 1,0
-- Blue: 0,1
-- Green: 0,0
How to interpret a regression model when some variables are log transformed
Different types of means (where a and b are two values and n is the number of values):
- Arithmetic mean (AM): sum(a+b)/n
-- Use when data is in an additive relationship. - Geometric mean (GM): nth root of (ab) = sqrt(ab)
-- Use when the data is in an multiplicative relationship (or compounded eg with compounding interest) - Harmonic mean (HM): n/(1/a + 1/b)
-- Use for rates
- HM<GM<AM
======================================================
dependant-independent log transformed models:lin-log:
- A P % change in the untransformed independent variable x changes the untransformed dependent variable y by (P/100) units.
- The model is: y=b0+b1*log(x)
- Therefore, a P % change in the untransformed independent variable x changes the untransformed dependent variable y by ((P/100)*b1) units.
log-lin:
- A 1 unit change in the untransformed independent variable x changes the untransformed dependent variable y by 100%.
- A 1 unit change in the untransformed independent variable x changes the log-transformed dependent variable y by 1 unit.
- The model is: 𝑦=𝑒^(𝑏0+𝑏1𝑥)
- Therefore, a 1 unit change in the untransformed independent variable x changes the untransformed dependent variable y by (100*B1)%.
- NB. The interpretation above only works when b0+b1*x is very small. The accurate percentage change in y is actually ((exp(B1))-1)*100 % for a one unit change in x.
log-log:
- A 100 % change in the untransformed independent variable x changes the untransformed dependent variable y by 100%
- A 1 unit change in the log transformed dependent variable y changes the log-transformed dependent variable y by 1 unit.
- The model is: log(y)=b0+b1*log(x)
- Therefore, a 100 % change in the untransformed independent variable x changes the untransformed dependent variable y by (100*b1)%
NB. log to % relationship is only valid up to around 20%
================================================
Odds against:- ratio of failure:success (where failure is the number at the beginning)
- If the odds are 10:1 against and you bet $1 and win you receive $10 + $1
Odds for (also called odds on):
- ratio of success:failure (where success is the number at the beginning)
- If the odds for are 10:1 for and you bet $10 and win you receive $10 + $1
- odds for= p/(1-p)
- eg. 3:2=p/(1-p)=(3/(3+2))/(2/(3+2))=0.6/0.4=3/2
To convert odds for to adds against, just reverse them (eg. 2:1 becomes 1:2)
Logistic regression model:
- p=exp(a+bx)/(1+exp(a+bx))
- odds for = exp(a+bx)=p/(1- p)=p (will happen)/p(won't happen)
- 1-p=1-(exp(a+bx)/(1+exp(a+bx)))=1/(1+exp(a+bx))
- log(p/(1- p)) is the output of the regression model. It is the log odds. It is logit(p)=log(p/(1- p))=a+bx=log(exp(a+bx)). Use exp(log(p/(1- p))) to find the odds. The odds is p/(1-p)
- p =(odds for)/(1+odds for) = p/(1-p) / (1 + (p/(1-p))) = probability of y=1 = probability of success
- Probability of failure is 1-p.
- A 1 unit change in the untransformed independent variable x changes the untransformed dependent variable y (=odds for = p/(1- p)) by (b*100)%. This means the 'odds for' (i.e probability success/probability failure) will change by b, holding all other variables fixed. More precisely it is: (((exp(b))-1)*100)%
- A 1 unit change in the untransformed independant variable x changes the log (y) transformed variable by b. This means the natural log of the 'odds for' (i.e probability success/probability failure) will change by b, holding all other variables fixed.
- p=p(x)
- p ranges between 0 and 1
- if p >0.5 then y=1 otherwise y=0
- intercept = log odds when all other terms=0
Good explanation of the difference between probabilty and odds
A good introduction to Linear Regression Models with Logarithmic Transformations
a good explanation of Bayes Theorum
Unbiased means that "on average" the estimate will be correct.
Covariance value has no upper or lower limit and is sensitive to the scale of the variables.
Correlation value is always between -1 and 1 and is insensitive to the scale of the variables.Operating performance: Operating performance measures results relative to the assets used to achieve those results. The focus of determining Operating Performance is on how well assets are converted into earnings, and how efficiently resources are used to generate revenue.
How to install Data Explorer:
if (!require(devtools)) install.packages("devtools")
devtools::install_github("boxuancui/DataExplorer")
-
Brief MGT6203 Review
MGT6203 "Data Analytics for Business" is an easy A if your work/family/other commitments permit it.
The program was quite useful to consolidate regression model, forecasting and queue theory. In addition, learning the fundamentals of factor investing and measuring risk adjusted performance was a particular highlight for me. I also learned a thing or two about digital marketing and it was great that Professor Bien regularly chatted with his students.